
Authors


U.S. commercial paper market: ABCP leads the expansion amid tighter funding conditions
The U.S. commercial paper market has continued to expand in 2026, led by ABCP, which has gained share within the market while issuance has shifted further toward the very short end of the curve.
Against a backdrop of higher rates and tighter funding conditions, ABCP has remained an important funding channel for dealers, while also showing greater sensitivity during periods of market stress.
This bulletin reviews the latest trends in market size, issuer composition, tenor mix and spread dynamics.
U.S. commercial paper market extends its growth
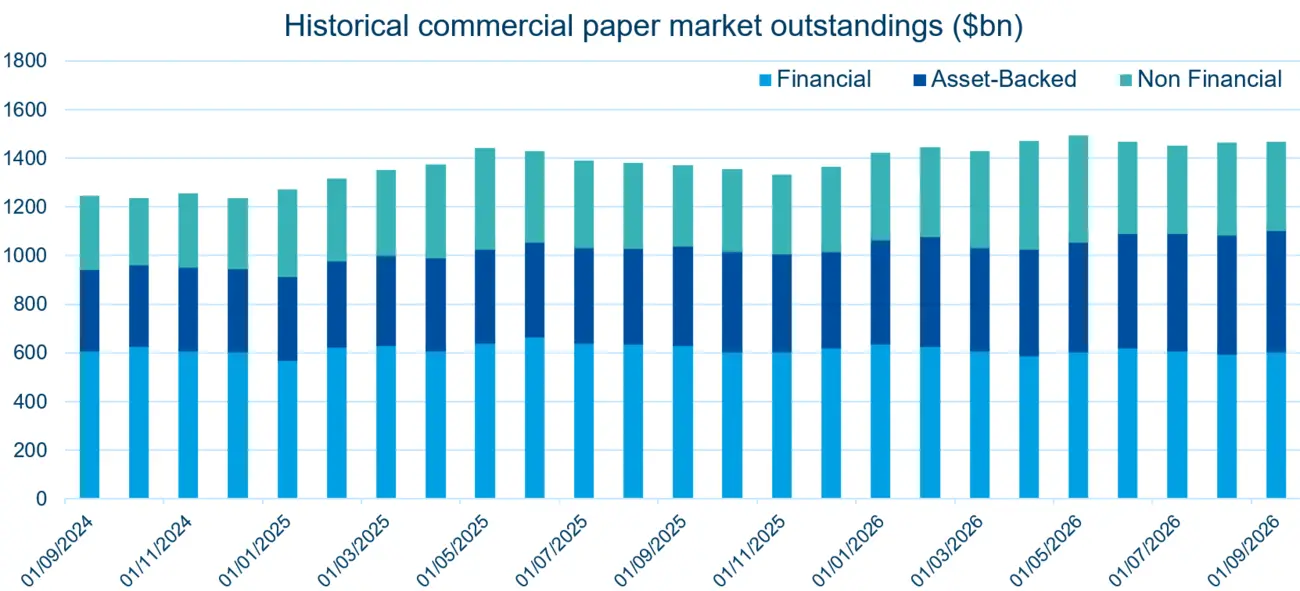
The U.S. commercial paper market has shown an upward trajectory since the beginning of the year, with outstanding volumes rising to $1,466bn from $1,365bn at the start of the year. Breaking this down by issuer type, financial issuers account for 43% of total outstanding, down 4 percentage points since the start of the year. By contrast, the share of ABCP has increased from 31% to 34%, while corporate issuance has edged up modestly.
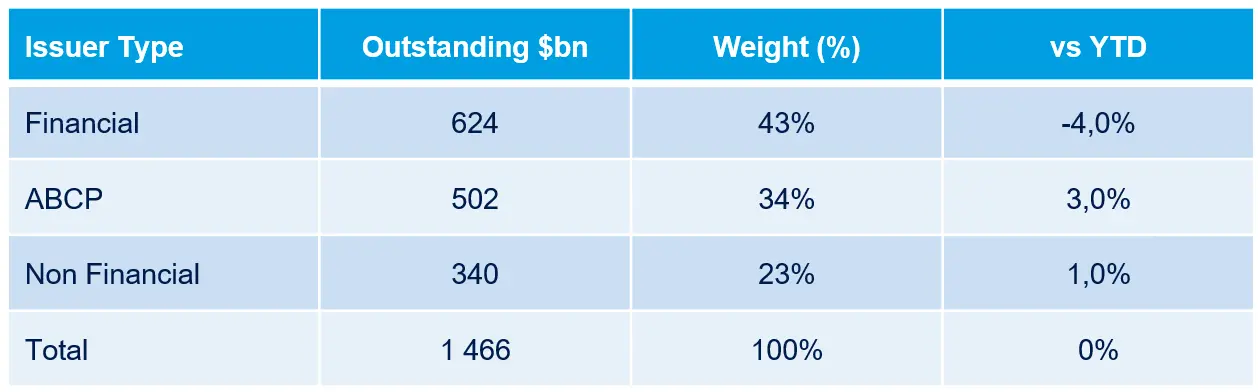
Source: Federal Reserve as of 23/09/2026
ABCP remains the main driver of growth
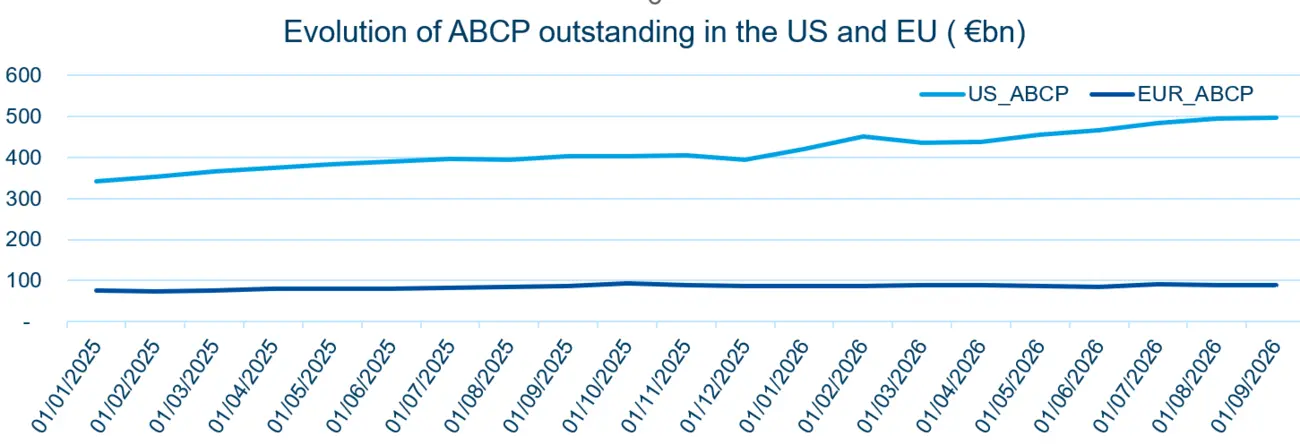
Within this broader trend, ABCP has been the standout segment. Outstanding ABCP has climbed to nearly $502bn, representing a 17% increase year-to-date. This compares with Europe, where ABCP has also remained on an upward path, but at a more moderate pace.
Looking ahead, we expect ABCP outstandings to remain elevated, particularly as dealers continue to seek alternative sources of financing for both fixed income and equity collateral, supported by off-balance-sheet solutions and funding optimization.
Source: Federal Reserve as of 23/09/2026
Source: CMD Portal as of 01/09/2026
A clear spread hierarchy across issuer types
From a spread perspective, a clear hierarchy emerges across maturities. The corporate issuer rated A2/P2 offers the highest compensation. Among the AA-rated issuers, ABCP provides the highest spread, followed by non-financial issuers, while financial issuers offer the lowest spread within this group.
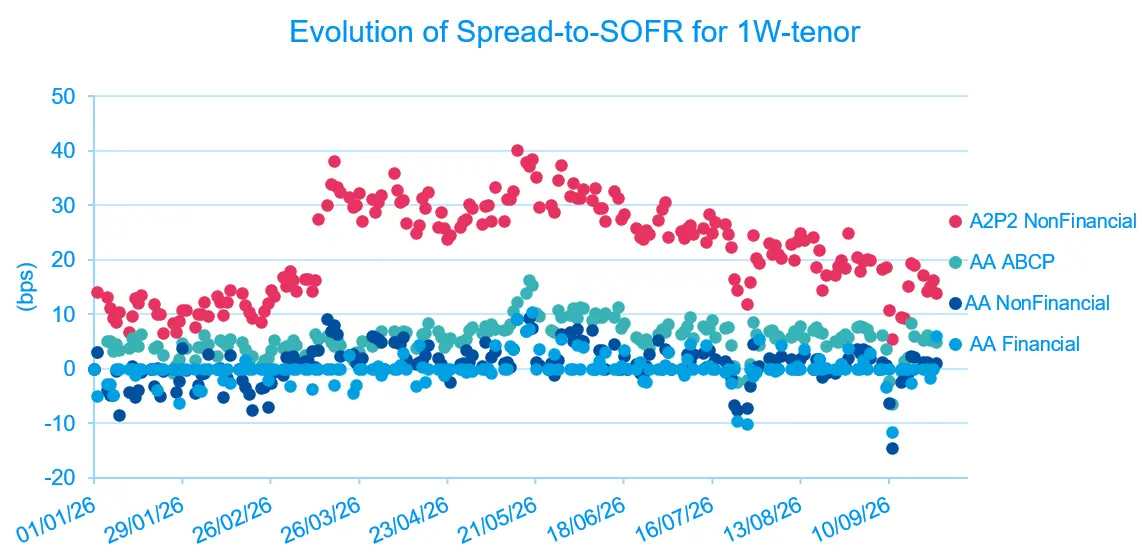
Source: Federal Reserve, Bloomberg as of 23/09/2026
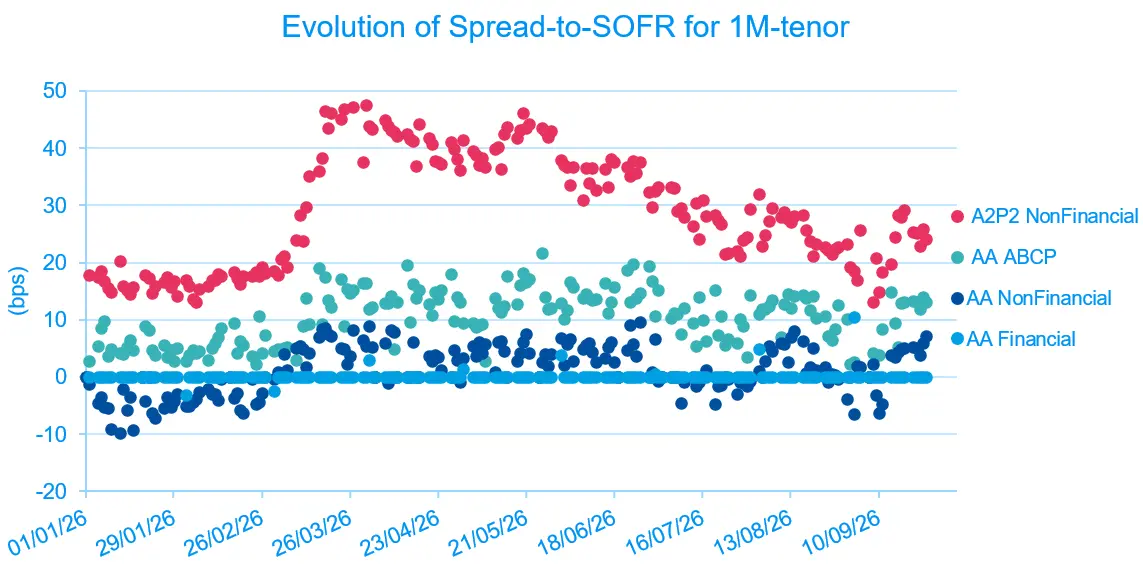
Source: Federal Reserve, Bloomberg as of 23/09/2026
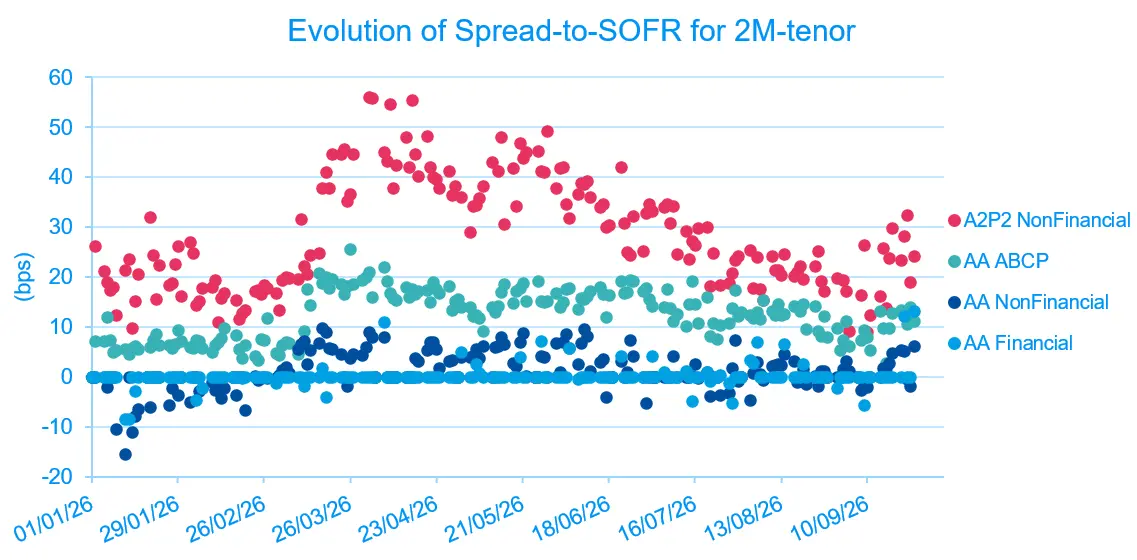
Source: Federal Reserve, Bloomberg as of 23/09/2026
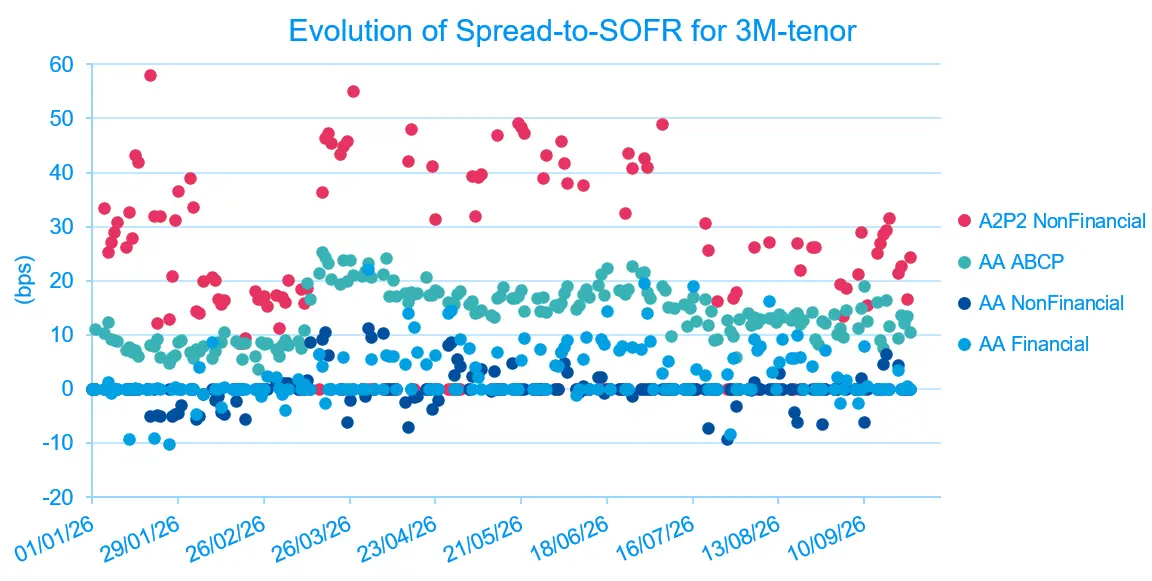
Source: Federal Reserve, Bloomberg as of 23/09/2026
Issuance continues to concentrate at the very short end
In terms of maturity, the U.S. commercial paper market remains large and highly liquid, with issuance concentrated at the very short end of the curve. In the context of the Fed’s rate-hiking cycle and the steepening yield curve shown in the graph below (Evolution of SOFR OIS rate), CP tenors have shortened further, reflecting both issuers’ preference for funding flexibility and investors’ appetite for shorter-dated paper in a higher-rate environment. As a result, the share of issuance with maturities of less than 9 days increased to 82% in September 2026, compared with 76% at the end of February 2026.
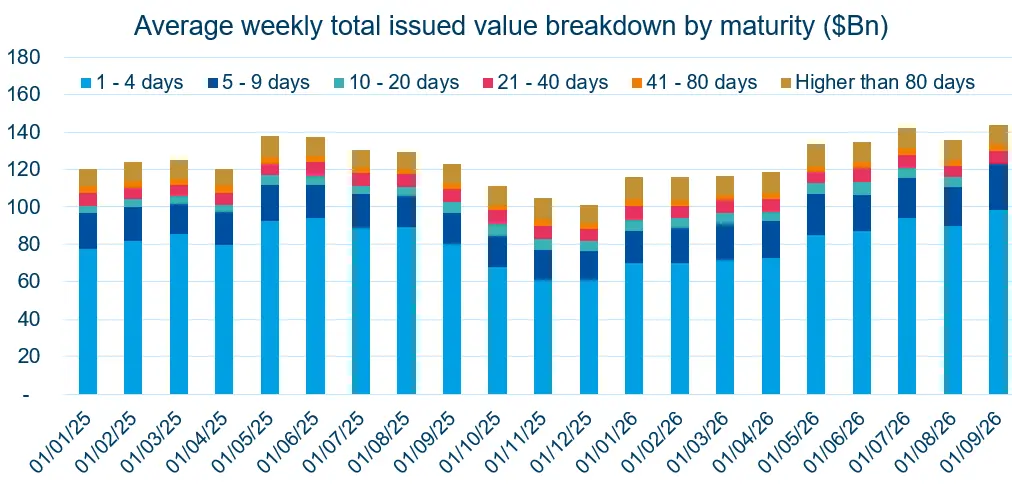
Source: Federal Reserve as of 23/09/2026
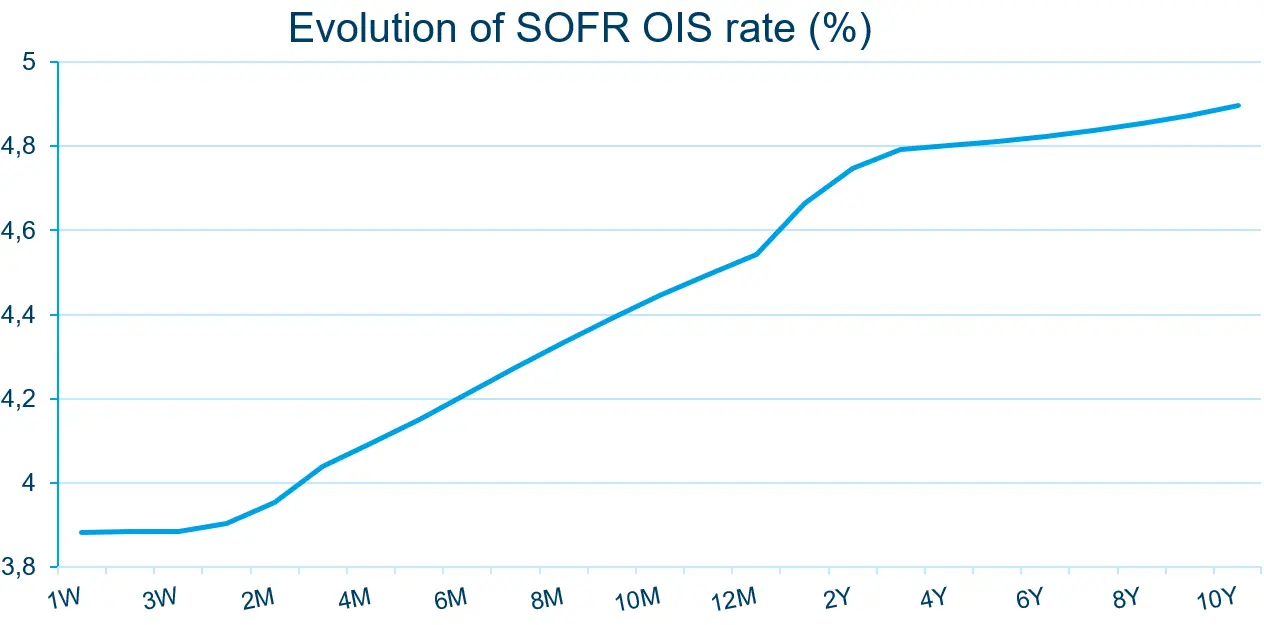
Source: Bloomberg as of 30/09/2026
ABCP offers a premium, but remains more vulnerable in stress
Looking more closely at ABCP, they typically offer slightly higher yields than conventional commercial paper issued by banks or non-financial corporates with the same rating. This premium reflects its greater structural complexity, indirect credit exposure, and higher liquidity risk. As a result, ABCP tends to be more vulnerable during periods of market stress.
This pattern is consistent with the charts below, which show that ABCP spreads generally remain above those of bank and non-financial commercial paper and react more sharply during stressed market episodes. In particular, the widening was especially pronounced in February, at the height of the crisis period.
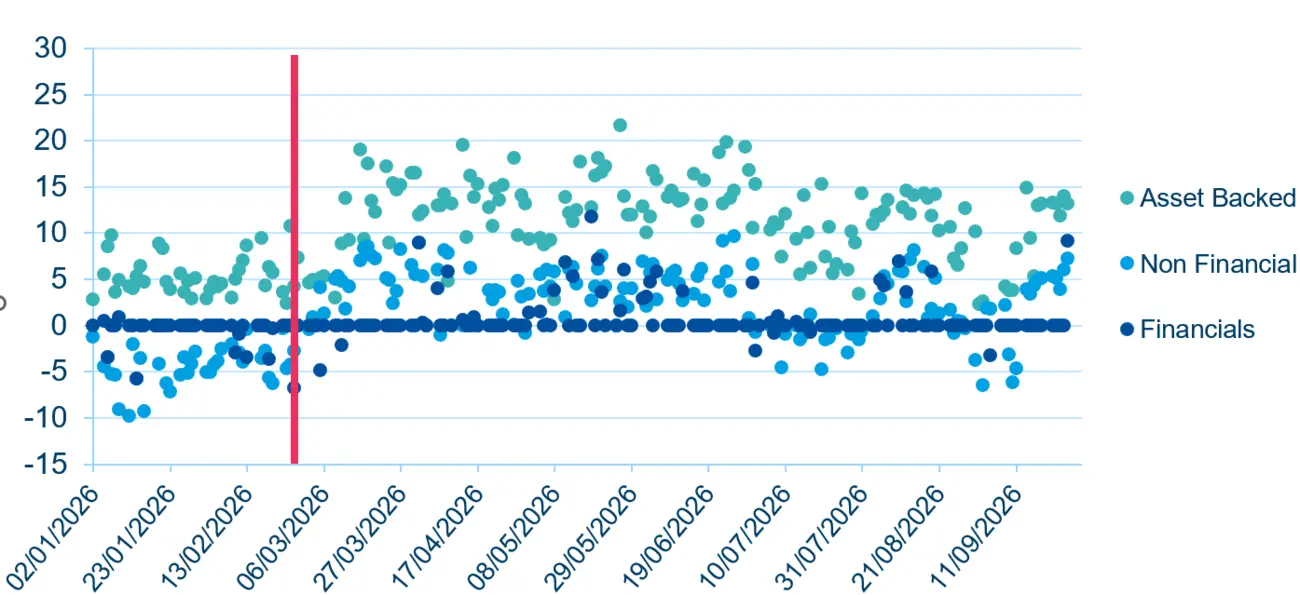
Source: Federal Reserve as of 25/09/2026
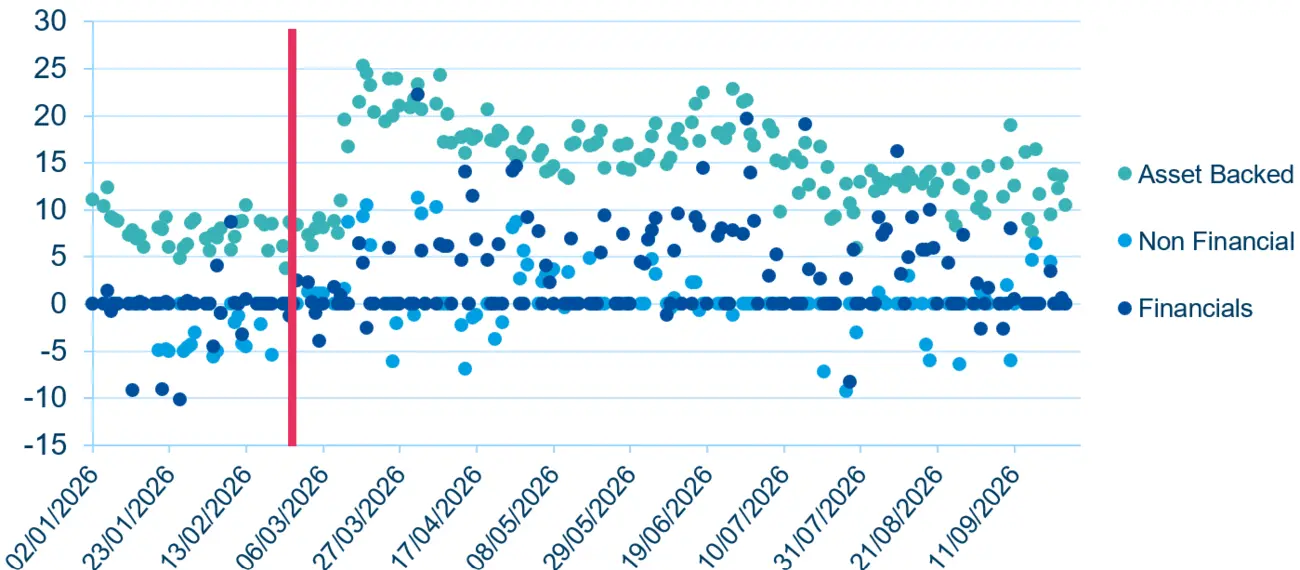
Source: Bloomberg, Federal Reserve as of 25/09/2026
ABCP spreads widen as equity financing costs rise
In addition to the widening observed during the crisis period, another episode of widening, beginning in June, appears to have coincided with a rise in the cost of financing leveraged equity positions. In this context, the cost of equity financing refers to the expense of borrowing against equity collateral to maintain leveraged long positions. This interpretation is consistent with the funding cost implied by AXW futures on the S&P 500 total return index, which reached a record high in June before easing later in the period. As financing costs increased, leveraged investors faced higher funding expenses relative to benchmark rates, making it more costly to sustain long exposure to U.S. equities.
In response, dealers may have relied more heavily on the ABCP market as an alternative source of short-term funding against equity collateral. As conditions in equity financing deteriorated, ABCP may have become a comparatively more attractive funding channel. The resulting increase in demand for ABCP funding, combined with broader market-wide funding pressure, may therefore help explain the renewed widening in ABCP spreads observed in June.
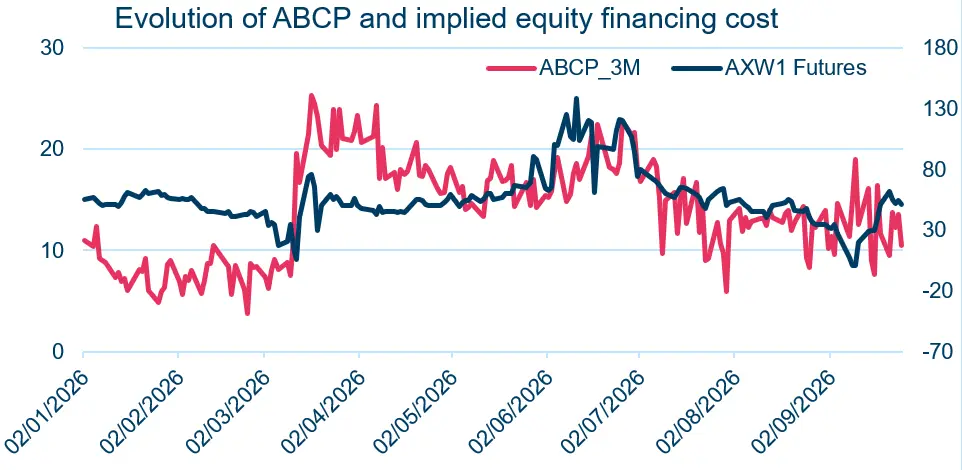
Source: Bloomberg, Federal Reserve as of 25/09/2026
ABCP remains central to market growth and funding sensitivity
In conclusion, the U.S. commercial paper market has expanded steadily this year, led by ABCP, which now represents a larger share of total outstanding.
At the same time, issuance has shifted further toward very short maturities, reflecting tighter funding conditions and stronger demand for flexibility.
On the spread side, ABCP consistently trades at a premium, and its widening during periods of stress, especially in February and again in June, suggests that it remains particularly sensitive to funding pressure, especially when dealers turn to it as an alternative source of financing.
Need clarification on the money market?
Discover our solutions